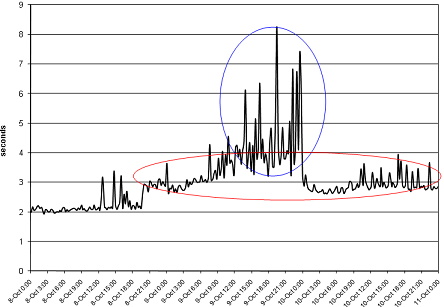
Many Web pages are comprised of content from a variety of sources. The base page (i.e. the HTML of the main page) may draw in content from one or more Content Delivery Network (CDN) providers, multiple ad providers, widget providers, partners, etc. When a page shows degraded performance, how do you quickly identify who is responsible?

Is this one issue or two? Where’s the problem? Who owns the resolution?
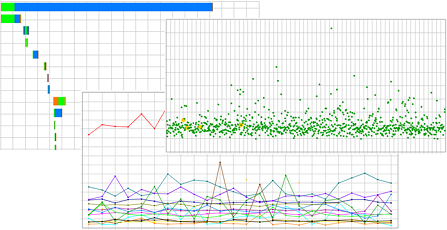
Typical troubleshooting involves examining various charts and metrics to try to identify the culprit(s). This can be very tedious and time consuming, and often requires specialized knowledge and experience.

How can we simplify the troubleshooting process? Make it available to a wider audience, and allow easier identification of problem ownership?
One step might be to break out the performance for each object on the page – essentially a time series for each unique URL of page content. But, a typical page contains more than 60 objects, and some pages more than 200. It’s just too much information to digest.
Adding a layer of abstraction, with boundaries aligned to typical areas of functionality or responsibility, would provide a very helpful first step. That is to say, define groups, or categories for all the domains on the page, and create a time series for each Domain Category.
For example, let’s say the domains comprising a page were mapped to the following categories:
- O&O (Owned and Operated)
- CDN (3rd-party Content Delivery Networks)
- 3rdParty (All other content, including ads, etc)
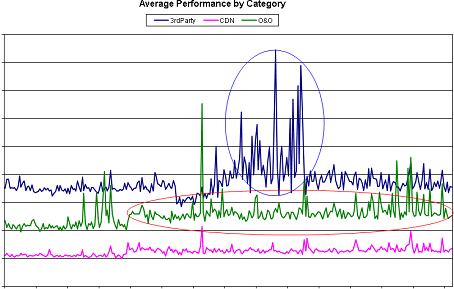
Looking at the performance by Domain Category, we can begin to see more information:

Specifically, we can see there were actually two separate performance issues, one was caused by 3rdParty content, and the other by O&O content.
The next step would be to drill down within each category (e.g. initially at the domain level, then at the object level, if needed) to get a better sense of the actual root cause. All this can be done manually via Pivot Tables in Excel, but automation is highly recommended.
While this provides the basic mechanics of the technique, there are some more details that require consideration. Note that the Domain Category chart above is labeled “Average Performance by Category”. The method of aggregating the performance results for all the objects in a category was simply arithmetic mean.
While it’s a simple approach, the mean can also hide important information. Another simple approach would be arithmetic sum. Again – simple but lacking.
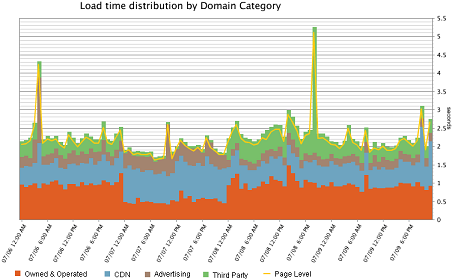
Ideally, we’d like an aggregation method that computes the contribution each Category (or domain, or object) makes to the overall page load time. In other words, for a Domain Category graph like that above, the three lines could be summed to obtain the page-level load time (top graph).
Visually, using a stacked area graph, it might look like:

Note that this example adds another category to break out advertising domains, and is for a different time period than previous example graphs.
One way to accomplish this, and what we’ve done at AOL, is develop an algorithm for computing the load time contribution for objects in each category. This can be applied via post-processing of performance data, so is independent of the tool used to collect the data.
Another approach is to build this functionality into the performance measurement tools, as Keynote has done with their Virtual Pages, and Gomez has done with their Contributor Groups.
Whichever approach you choose, the additional information provided by performance visualization using domain categories can be a valuable troubleshooting tool.

The idea of breaking down overall performance into categories by type of content is great. The hard part is, the load time of a page is not the sum of the individual parts. While some JavaScript is executing, downloads are happening. And while a download is happening, rendering might be blocked. And multiple downloads often happen in parallel. Can you expand on how you allocate page load time to individual categories given the high degree of overlap during page load?
Great questions, Steve.
To paraphrase: When distributing load time among categories, how are the following cases handled?
– Time gaps where the client is processing JS, but nothing is being downloaded
– Multiple objects being downloaded in parallel
First, let me provide some additional context for the problem space. The focus of this type of reporting is for operational monitoring, as opposed to pure performance measurement. So the goal is quick problem identification, isolation, and resolution.
The characteristics of time gaps due to client JS processing are dependent on the available resources on the client machine, which can vary greatly depending on the type of computer and what other things are happening on it. Since the focus of operational monitoring is on the delivery of content to the user, these client-side processing gaps are ignored in the data. So, both the category times and page load times do not include these gaps.
When multiple objects are loaded in parallel, the time is shared among all the objects loading at any moment in time. For example, if the load time of a page is divided into 10ms slices, and 5 objects load in parallel during a particular time slice, then each object is assigned 2ms of time (10 / 5) for that slice. Those times are summed for each object (or category) to determine the contribution to page load time.
This approach fulfills the goals above in helping understand the distribution of load time among categories (or domains), and quickly identifying drivers of a performance change. However, it is not intended as a development tool to estimate time savings for removing content. If page content is changed, the load behavior will change (the order objects are retrieved, the amount of parallelism, etc.), so the distribution of time to the various categories (or domains) will also change.
-Eric