A little more than a year ago, AOL released PageTest to the open-source community. Since then, more than 35,000 tests have been run at webpagetest.org, and it has been downloaded more than 5,000 times from SourceForge.
Creator Pat Meenan has been busy adding some new features lately that provide even more performance information.
New Visualization – Content Breakdown
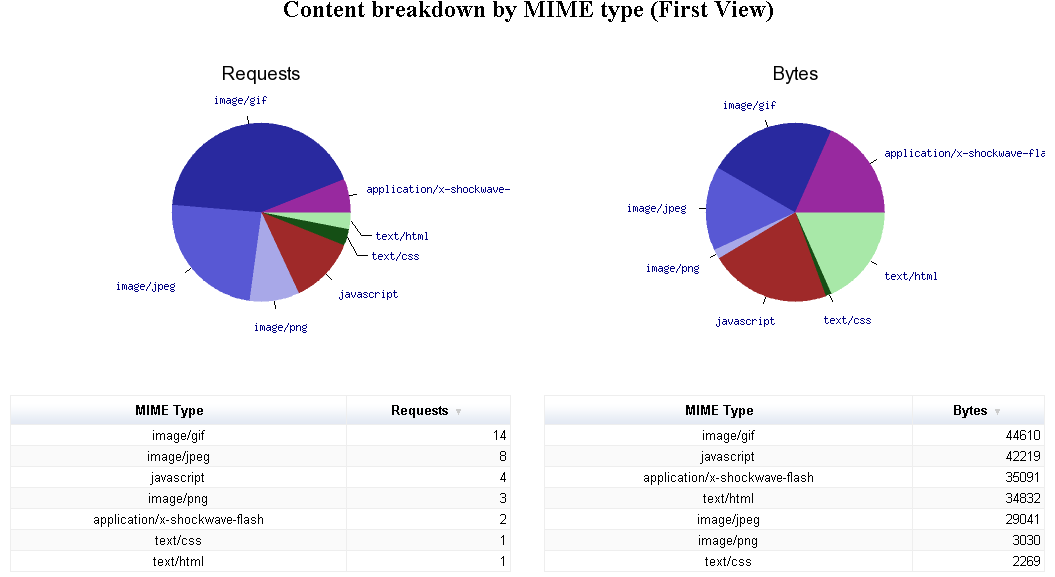
The main results page for a test (example), which shows thumbnail links to Waterfalls, Optimization Checklists, and Screen Shots, now also shows Content Breakdown details. Clicking on that thumbnail shows the information, organized by MIME type, in graphical and tabular form (example).
In addition, a Connection View (discussed below) is provided by content type.

New Visualization – Connection View
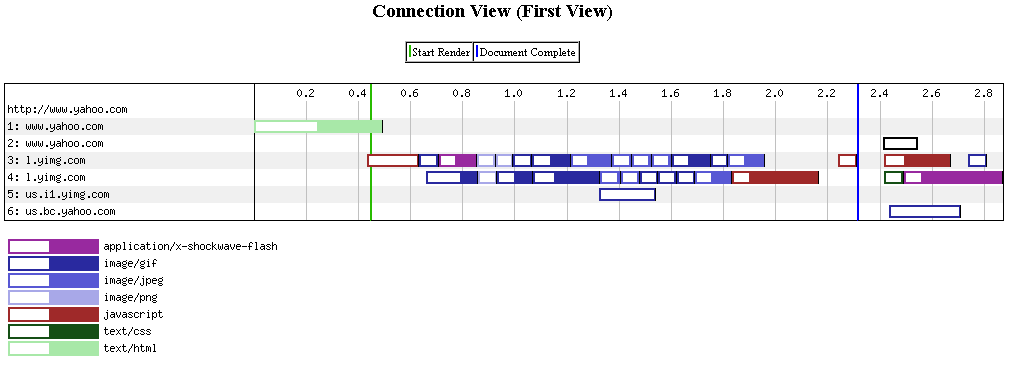
Looking at a waterfall diagram goes a long way to understanding how page objects load, but doesn’t explicitly show how efficiently connections are used (and re-used). Beneath the normal Waterfall View (example), PageTest now displays a Connection View, which shows how many connections were established to each domain, and which objects were loaded over which connections.

Hover over any of the colored segments for a connection to see the object that was loaded at that time.
Content Blocking
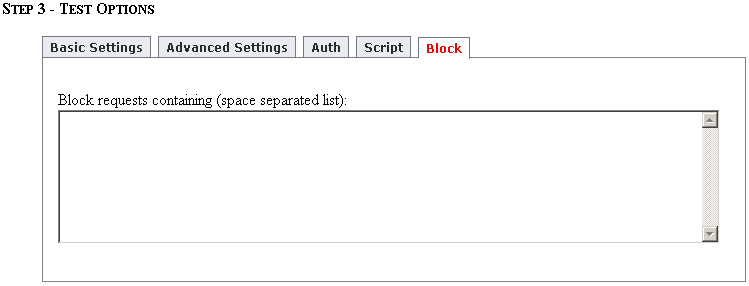
Ever wonder how your page would look without certain content (like ads, for example)? When entering test information, a new option added to “Step 3 – Test Options” called “Block” allows you to block content from the test.
Simply enter space-separated string fragments, and any requests containing any of the fragments will not be made.
For example, many ads start with a call to a URL that performs targeting logic, and starts a chain of other calls that load the ad components. A fragment list that identifies those targeting logic URLs can be used to block all the ad components, tracking objects, etc.
Data Table
Waterfall diagrams are a great visualization tool, but sometimes you want to see the data in tabular format. The new Request Details table, beneath the Waterfall and Connection diagrams does just that.
In addition, object source location information is also provided, based on the IP address.


