Your Web site experienced an outage or degradation of some kind – an installation gone wrong, a server crash, a network problem, etc. How do you quantify the impact of that event?
Wouldn’t it be great to be able to assign a dollar value to an outage? That can go a long way to help build a business case for more servers, new switches, better QA procedures, etc. to reduce the likelihood of future outages.
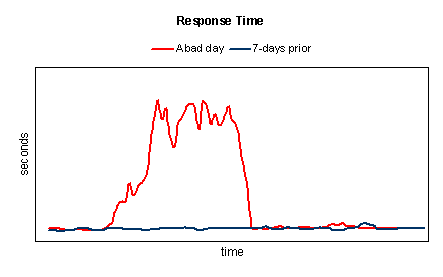
Let’s examine some real-world data. This Web site is having a bad day. Response time is high:

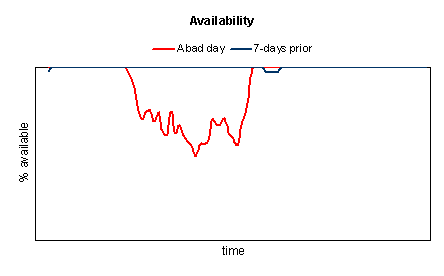
and availability is low:

But how do we know this is not normal response time and availability for this site? We can determine this by comparing today’s performance with prior data.
In the graphs above, comparing the red line (today) with the blue line (same day last week), it’s clear that today’s performance is not typical.
When choosing prior data to compare against, it’s important to choose the same day of the week, to exclude the impact of any cyclical usage patterns (e.g. people generally don’t check stocks on the weekend, when the markets are closed).
It’s also important to use recent data, not more than a week or two old, in order to exclude the impact of seasonality or similar access patterns that change over larger spans of time.
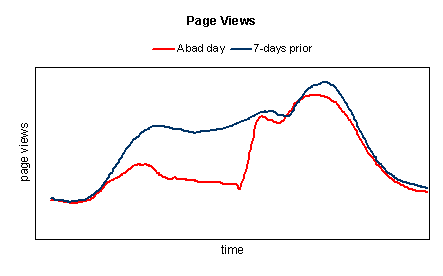
Now that we’ve determined there has been an outage, how do we quantify the impact? The Page Views tell the story:

Again, comparing today’s Page Views with the same day last week, there’s a clear correlation with the outage time period. Using this method, it’s easy to quantify the loss of Page Views during the outage.
Now, how do we turn this into a dollar figure?
For many Web sites, Page Views are one of the business metrics used to gauge performance. And in many cases, revenue is directly tied to Page Views, often via advertising. Once the Page View loss during an outage is quantified, it follows that the corresponding revenue loss can also be quantified.
By using good day data to contrast to bad day data, it’s easy to identify outages and resulting usage loss, which can then be used to estimate the impact to your bottom line.

What you end up representing is more of an “actual unavailability” of a site rather than a “wall clock” availability that a typical, synthetic monitoring provides (both have their purposes). By determining the % of “missed page views” you are theoretically representing the % of failed requests by the user, or the perceived unavailability to them. Thus, with this method, the impact of an outage near peak (like your example) is more than a maintenance outage at 4am.
The next step after calculating the revenue impact would be to calculate an operational support cost for addressing the incident. This includes:
– On call time spent on addressing the issue
– NOC attention to the issue
– Additional monitoring/tools established to detect in the future
– Post Mortem meetings/attention
– Future dev/process work needed to fix the bug/root cause
In an ideal world, if adequate costing information exists, you should be able to correlate reduced TCO for operational support with improved Availability, in addition to improved customer sat and revenue.
Mark